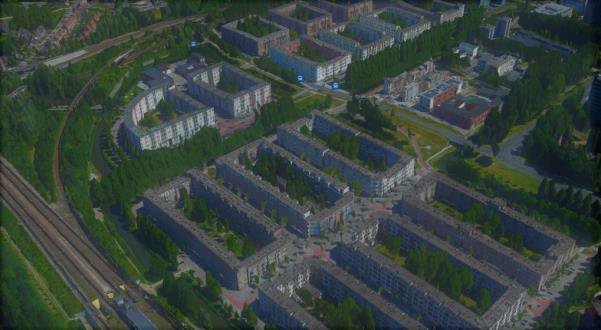
The commission
The City of Amsterdam’s Climate Adaptation Programme put one question to us: how do we arrive at a socially just climate adaptation plan in the already built-up city? The city’s Climate Adaptation Strategy and its 2021 Implementation Agenda follow the national Delta Plan on Spatial Adaptation and its four climate themes (heat, drought, water nuisance, flooding). The technical side of adaptation is well understood. What the municipality wanted was insight into the social side: what stands in the way of adaptation for socio-economically disadvantaged residents, what opportunities exist, and how to prioritise them within and across neighbourhoods.
Our case was Venserpolder, the north-western corner of the Bijlmermeer in Amsterdam Zuidoost. It is a designated ontwikkelbuurt, one of the priority development neighbourhoods that receive additional investment in public space, housing quality and residents’ socio-economic position. Heat stress and waterlogging are measurable here. So are low incomes, high crime, loneliness among older residents and weak cohesion across a very diverse population.
The policy gap
The brief sat in a gap the municipality had identified itself. Amsterdam frames its sustainability agenda through the Stadsdonut, its adoption of Kate Raworth’s Doughnut Economics, in which a social foundation and an ecological ceiling together define the safe and just space for the city. In practice, adaptation policy was anchored in the ecological and economic legs of sustainability, while the social floor was barely operationalised. Climate adaptation was also not yet embedded in Circular Area Development, the city’s tool for connecting material flows with the social processes already present in a neighbourhood, nor in the Omgevingsvisie 2050 commitment to samen stad maken, shaping the city together with residents.
Our task was to make that social lower limit concrete for one neighbourhood: to say what a climate-proof Venserpolder would have to do for its residents, not just to its streets.
Approach
We ran a full design-thinking cycle over four weeks: empathise, define, ideate, prototype, test. The method is deliberately human-centred and co-creative, and the client’s programme manager for Green & Blue in Zuidoost was our contact throughout.
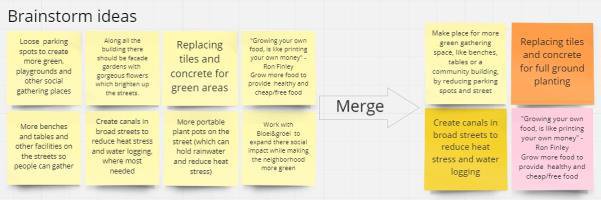
In the empathise phase we triangulated the city’s climate stress-test maps with desk research, walking observation and interviews with residents, the neighbourhood broker, the homeowners’ association and local initiatives. A stakeholder map and a structured “six honest questions” analysis (who, what, when, where, why, how) shaped the fieldwork. We then defined the challenge as a how might we statement, generated and clustered ideas, converged on one intervention, built a visual prototype and took it back to residents for feedback.
Diagnosis: where climate stress and social stress overlap
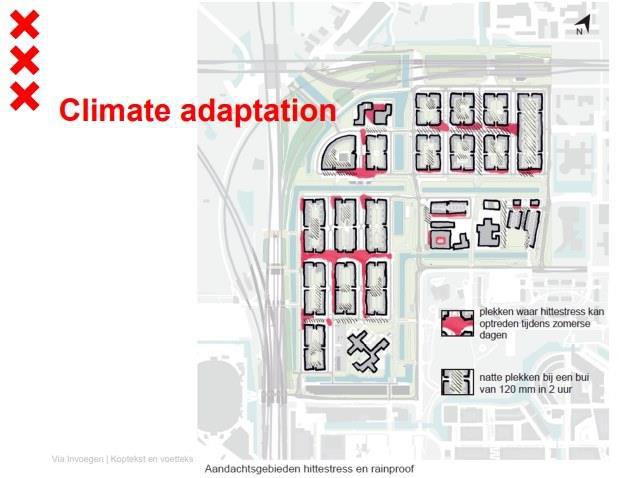
The urban heat island effect is visible in Venserpolder. The streets between the blocks are about 25 metres wide and, apart from a few trees, consist entirely of brick and asphalt, materials that absorb heat and release it slowly. The same flat, low-lying, sealed surface hinders infiltration, so heavy rainfall pools on the streets. The stress-test maps concentrate both problems on two streets: Alfred Döblinstraat for heat, Chestertonlaan for waterlogging.
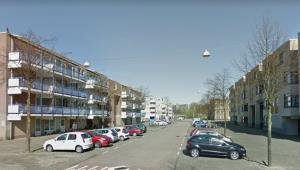
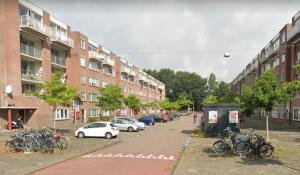
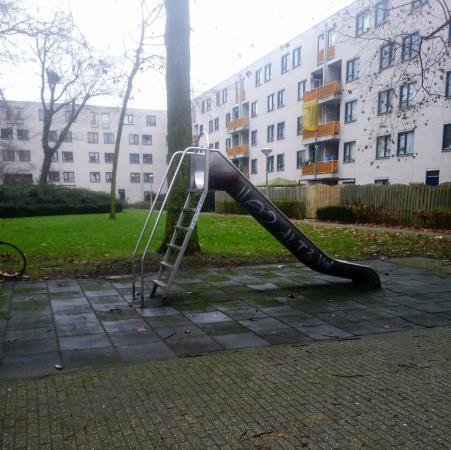
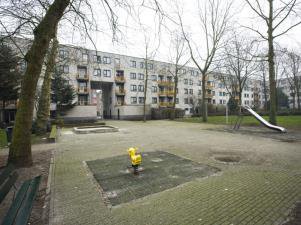
The social picture was sharper still. The neighbourhood broker told us that climate adaptation is hard to even raise, because most residents are dealing with several problems at once: violence, debt, unemployment, poor housing. Residents described the area as “the Bronx of Amsterdam” and pointed to where recent shootings had happened. Homes are badly insulated, cold in winter and hot in summer. Public space is described as dirty. There are many playgrounds but few that older children find worth using, and few organised activities. Language and cultural barriers between groups limit cohesion.
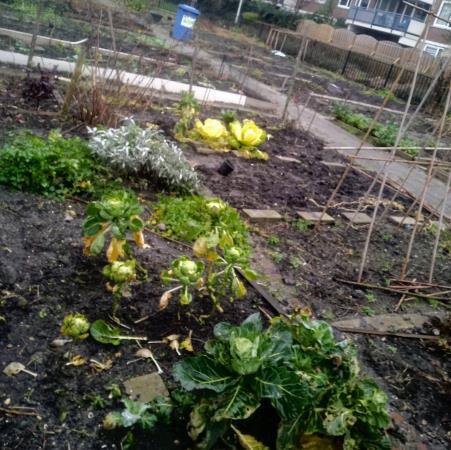
There were also assets. Bloei & Groei, a women’s empowerment gardening initiative, runs allotments in the inner courtyards. Community centres such as Multibron and Anansi are heavily used. Several residents, including the homeowners’ association, actively care for the neighbourhood and already talk to the municipality about greening subsidies.
The proposal: a blue-green corridor
We narrowed the plan to the physical properties of the streets, because that is where climate stress is concentrated and where public space could also become a place to meet. The intervention converts the two most stressed streets into canal parks: a canal of eight to ten metres, connected underground to the existing water structure at the intersections, flanked by grass, trees, community vegetable gardens, benches, more challenging play equipment for teenagers, and a community building at the midpoint of each street. Cycling and walking paths remain; through traffic does not.
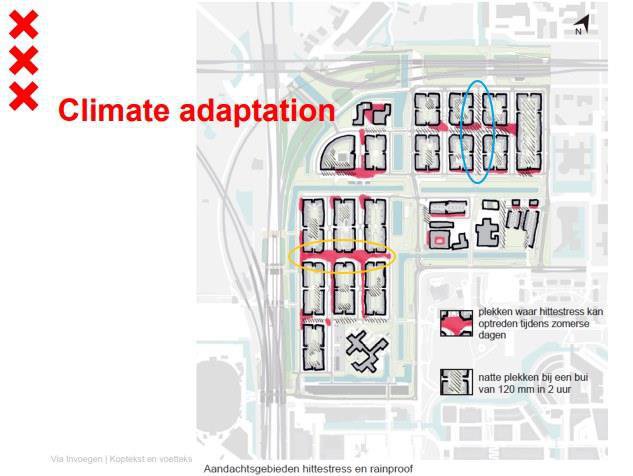
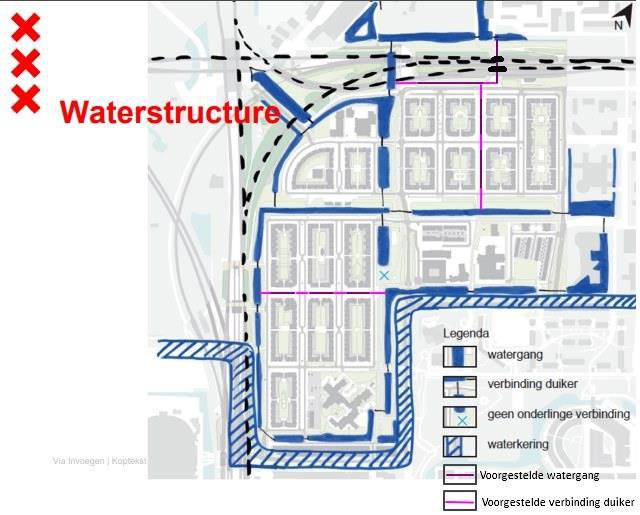
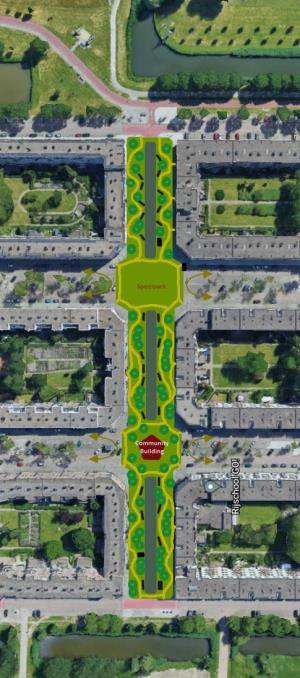
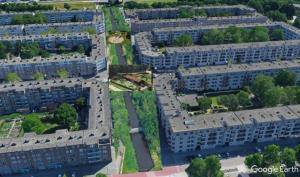
The justification draws on the blue-green infrastructure literature: urban canals cool their surroundings by roughly 0.3 to 1.6 °C through evaporation and thermal capacity, and vegetation adds daytime shade and evaporative cooling. Unsealed soil and open water also absorb the rainfall that currently pools on the street. We checked feasibility against parking (about 260 of more than 3,200 spaces removed, against roughly 2,000 resident-owned cars) and against the road network, which stays intact because the water connections run underground.
What the test phase taught us
When we brought the prototype back to residents, they rejected it, and their reasoning is the most useful result of the project. The objection was not climatic but distributive: a capital-intensive landscape intervention would spend money that, in their eyes, should go to safety, income support and housing quality. Several also recalled earlier municipal community-building projects that were launched, not maintained, and abandoned, which has left a deficit of trust.
Read through the distinction between distributional, procedural and recognitional justice, what is most at stake in Venserpolder is procedural: who is involved in deciding how adaptation money is allocated, and whether residents’ own priorities are recognised in that process. A plan that is right about heat and water but wrong about who decides is not socially just.
Recommendations to the client
- Keep the long-term blue-green plan, but present it as part of an integrated package that also addresses housing insulation and safety, not as a stand-alone climate investment.
- Start short-term with resident-led greening. Active residents were already negotiating subsidies to green tree pits and facades together with Bloei & Groei; the fastest socially legitimate adaptation gains run through them.
- Bring existing initiatives out of the courtyards. The allotment community has both the affinity and the local knowledge; giving it space on the streets would extend its reach and visibility.
- Expand community-centre capacity. The centres are where residents already gather; the community building in the design could serve that need.
- Clarify the division of responsibilities between municipality and residents, so that active residents know what they can act on and what they can hold the city to.
- Involve locally rooted institutions and residents in both decision-making and implementation of any future project, including this one, so that plans persist beyond their launch.
Frameworks and sources
Delta Plan on Spatial Adaptation · Amsterdam Climate Adaptation Strategy and Implementation Agenda · Ontwikkelbuurten programme · Stadsdonut and Doughnut Economics · Circular Area Development · Omgevingsvisie 2050 and samen stad maken · Design thinking and co-creation (IIS) · Urban heat island and blue-green infrastructure literature (Gunawardena & Kershaw 2016; Lindberg et al. 2016; McDonald et al. 2019; Fung & Jim 2020; Su et al. 2018) · Climate justice framework (Patterson et al. 2018).
Maps are drawn from the City of Amsterdam’s climate adaptation stress-test viewer and annotated by the project team. Photographs of the neighbourhood were taken by the team during fieldwork in January 2022, except where Google Street View or Google Earth is credited. No residents are shown.